Sinusoids
- A general class of signals called cosine or sine signals.
- Write the general formula for a “sinusoidal” waveform or signal.
- From the formula, plot the sinusoid versus time.
- The most basic signals in the theory of signals and systems.
- Waveform is a SINUSOIDAL SIGNAL.
- Computer plot looks like a sine wave
- The mathematical formula: $x(t) =$ $Acos(2\pi (440)t+\varphi)$

- Sampling rate of 5563.6 samples/sec.

코사인 신호 또는 사인 신호라고 하는 일반적인 신호 종류
사인파 파형 또는 신호에 대한 일반적인 공식을 기록함.
공식에서 사인파 대 시간 그림 표시
신호 및 시스템 이론에서 가장 기본적인 신호
파형은 사인파 신호임.
컴퓨터 플롯이 사인파처럼 보입니다
TUNING FORK A-440 Waveform


$T\approx 8.15-5.85 =2.3ms $
$f = \frac {1}{T} = \frac{1000}{2.3} \approx 435Hz$
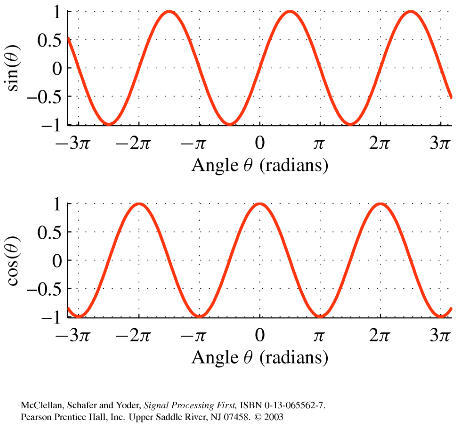
Sine and cosine function
- Sine and cosine functions plotted versus angle
- The sine function is a cosine function that is shifted to the right by $\frac{\pi }{2}$
- $sin\theta =cos\theta -\frac{\pi }{2}$
SPEECH EXAMPLE
- More complicated signal (BAT.WAV)
- Waveform x(t) is NOT a sinusoid
- Theory will tell us
- x(t) is approximately a sum of sinusoids
- FOURIER ANALYSIS
- Break x(t) into its sinusoidal components
- Called the FREQUENCY SPECTRUM
더 복잡한 신호.
파형 x(t)는 사인파가 아님
x(t)는 대략 사인파의 합임.
푸리에 급수 : x(t)를 사인파 구성요소로 분할함.
주파수 스펙트럼이라고도 부름.
Speech Signal : BAT
- Nearly Periodic in the vowel region
- Period is (Approximately) T = 0.0065 sec.

DIGITIZE the WAVEFORM
- x[n] is a SAMPLED SINUSOID
- A list of numbers stored in memory
- Sample at 11,025 samples per second
- Called the SAMPLING RATE of the A/D
- Time between samples is
- 1/11025 = 90.7 microsec.
- Output via D/A hardware (at$F_{samp}$)
x[n]는 샘플링된 사인파.
- 메모리에 저장된 숫자 목록
초당 11,025개의 샘플로 샘플링
- A/D의 샘플링 속도라고 불림.
- 샘플 간의 시간은 $\frac{1}{11025}$ = 90.7 microsec.
D/A 하드웨어를 통한 출력($F_{samp}$에서)
SINES and COSINES
- Always use the COSINE FORM (항상 코사인 함수가 메인)
$A(cos(2\pi(440)t+\varphi)$
- Sine is a special case : ↕
$sin(\omega t)=cos(\omega t-\frac{\pi}{2})$
SINUSOIDAL SIGNAL
- Computer plot looks like a sine wave
$Acos(\omega t+\varphi)$
- FREQUENCY $\omega$
- Radians/sec.
- Hertz (cycles/sec)
- $\omega = (2\pi)f$
- AMPLITUDE $A$
- Magnitude
- PERIOD (in sec.)
- $T=\frac{1}{f}=\frac{2\pi}{\omega}$
- PHASE $\varphi$
주파수 (빈도수) , 진폭 (크기) , 주기, 상
phase : shift advance
EXAMPLE of SINUSOID

PLOT COSINE SIGNAL
$5cos(0.3\pi t+1.2\pi)$
- Formula defines $A, \omega , and \; \phi$
$A = 5$
$\omega = 0.3\pi$
$\varphi = 1.2\pi$
PLOTTING COSINE SIGNAL from the FORMULA
$5cos(0.3\pi t+1.2\pi)$
-
Determine period:
$T = \frac{2\pi}{\omega} = \frac{2\pi}{0.3\pi} = \frac {20}{3}$
-
Determine a peak location by solving
$(\omega t+\phi =0) \Rightarrow (0.3\pi t+1.2\pi )=0$
-
Zero crossing is T/4 before or after
-
Positive & Negative peaks spaced by T/2
peak location : t = -4
위 식에서 peak location은 $1.2\pi$만큼 딜레이 됨.
zero crossing(0교차) : 양수에서 음수, 음수에서 양수로 변화가 일어나는 곳
양수와 음수의 정점은 주기의 절반만큼의 차이가 남.
PLOT the SINUSOID
$5cos(0.3\pi t+1.2\pi)$
- Use T = 20/3 and the peak location at t=-4

Relation of Frequency to Period
- Sinusodal sign with parameter $A = 20,\;\omega =2\pi (40),\;f=40,\;and \; \phi =-0.4\pi$
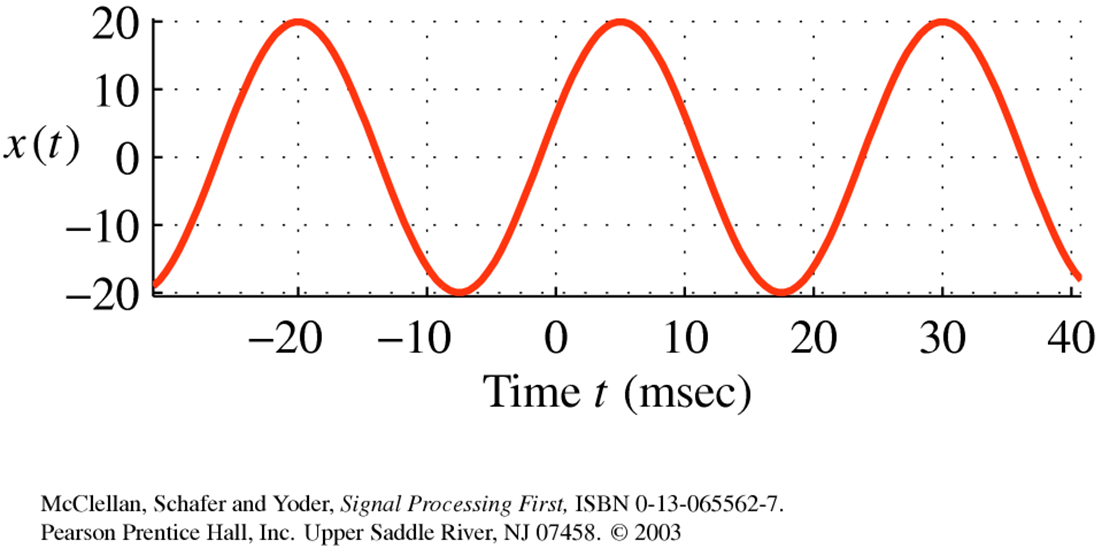
-
For the higher frequency, the signal varies more rapidly with time, the cycle length is a shorter time interval.


댓글